How to Use WTR
To use WTR, click the Green Run WTR Button
Then use the form to enter the values appropriate for the system of interest
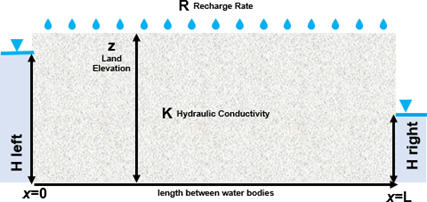
Use units of meters and days EXCEPT use millimeters and years for net recharge which is precipitation minus runoff minus evapotranspiration. The tool will convert it to meters per day.
Surface elevation is input as a reference value so as to raise a red flag when the water table is high relative to the surface. So you may want to use something less than the maximum surface elevation. Common sense needs to be employed when assessing results that have the water table close to the surface.
The water level can be higher on the left or the right.
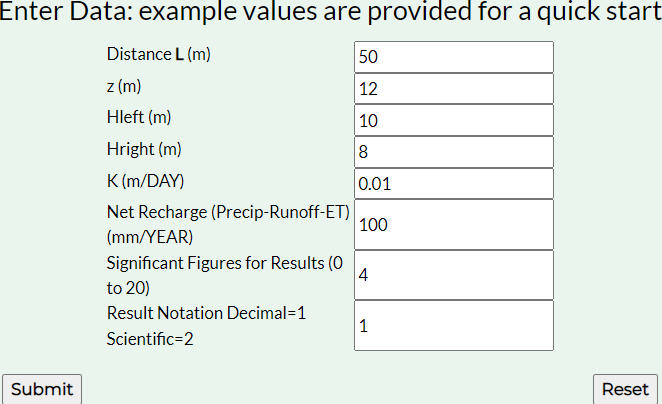
Then, press the Submit button and results will appear below the input form.
Explanation of Outputs
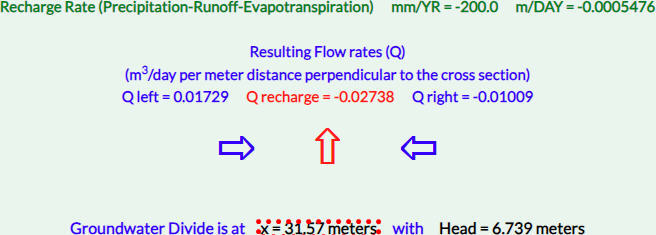
The net recharge is precipitation minus runoff minus evapotranspiration and is shown in millimeters per year, then converted to meters per day.

Next, flow to the left, top, and right boundaries is printed in cubic meters per day per meter of length “into the drawing”. That is, flow to or from each meter of land at the surface and each meter along the bank of the water bodies represented by the constant heads. Negative values represent flow to the left or up. Positive values represent flow to the right or down.
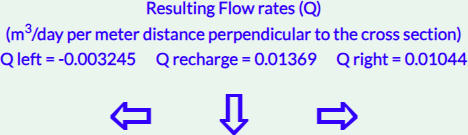
That is, 0.01369 = 0.003245 + 0.01044. It is important to recognize that for this analytical model, the sign of the flow rate indicates the direction of flow with positive being to the right and down, not flow into and out of the system as is the protocol for numerical models.
This is followed by the distance to the groundwater divide from the left boundary along with the head at that location.

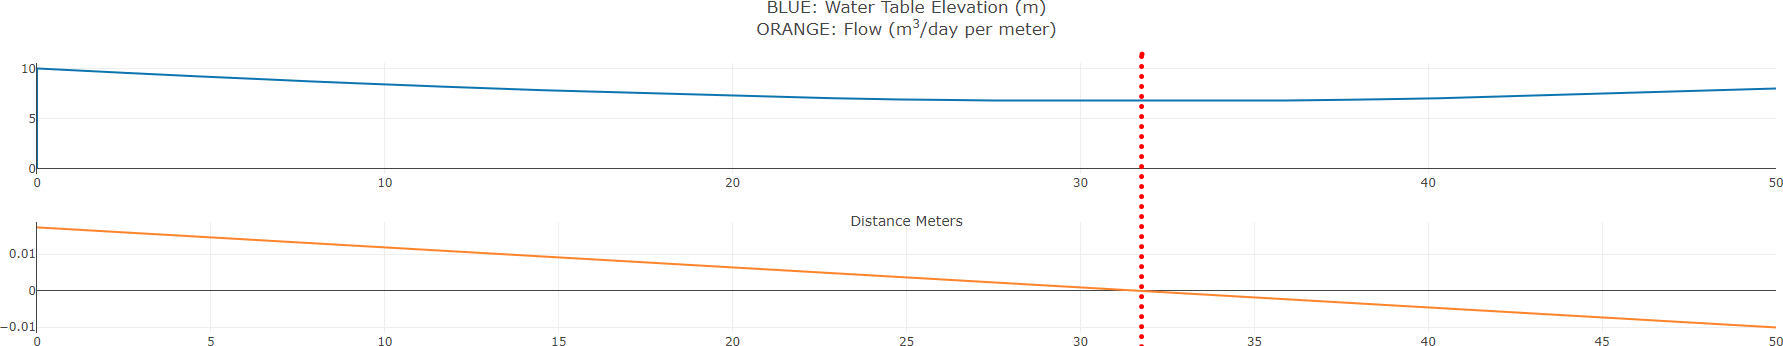
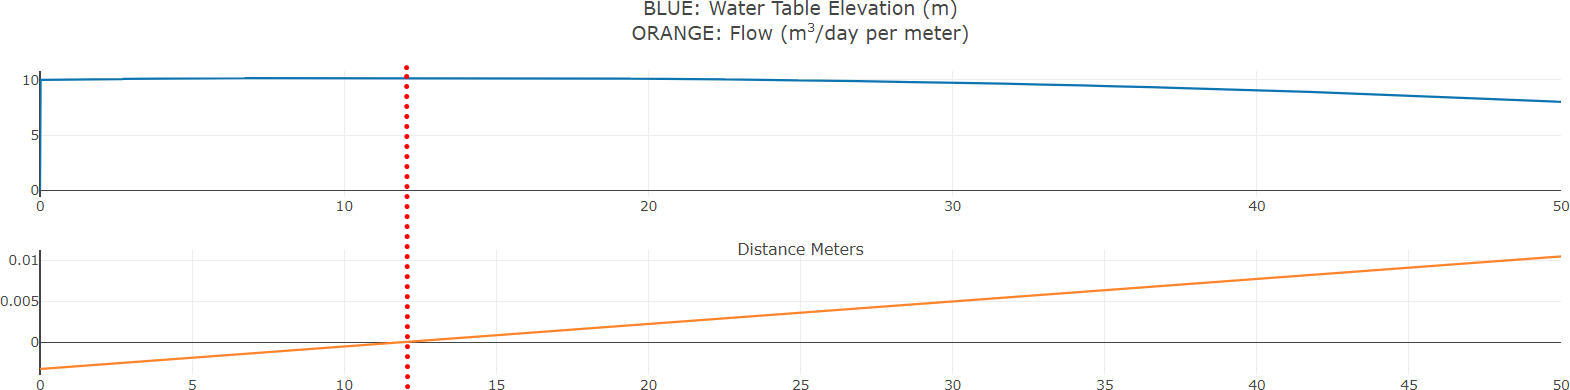
Below that, graphs of the water table elevation and the flow rate are displayed with elevation of the water table in blue and flow rate in orange. On a computer, hovering the cursor over the line of the graph indicates the y value at each x value. On a mobile device, lightly touching the curve provides the y value, while dragging your finger on the graph shifts and resizes it. If the adjusted view is not useful, you can return to the original view by pushing submit again.
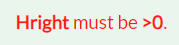
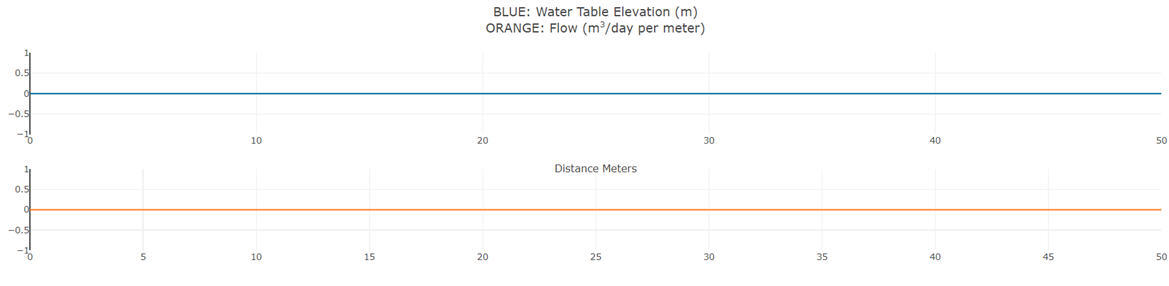
If unreasonable values are input, messages are provided to draw attention to input errors and to the possibility that the results are unexpected or unreasonable. For example, a negative value for a head at a boundary presents a physical impossibility because it means the thickness of the aquifer at the boundary is less than zero so no flow could occur. Thus, if -8 is entered for the head on the right, rather than getting results, a message appears in red indicating the head must be greater than zero. Results are not printed and the graphs show zero for every value of x. If I correct the error and press submit, the results are displayed.
If a combination of values is entered that results in the water table being higher than the land surface (in this case K=0.01 is changed to K=0.001), a red message appears indicating the difference between the maximum water table elevation and the ground surface elevation (as entered on the form). In this case about 8 meters (19.9-12). Given that only one value is input for surface elevation, the modeler may want to use something less than the maximum surface elevation given its only purpose is to raise a red flag when the water table is high.

If the net recharge is quite small (say 1mm/yr), a divide will not develop. The results will explain that the divide is calculated outside the domain at a distance equal to what would be required to accumulate sufficient recharge to equal the inflow at the boundary. This is a logical result mathematically but does not have physical significance.

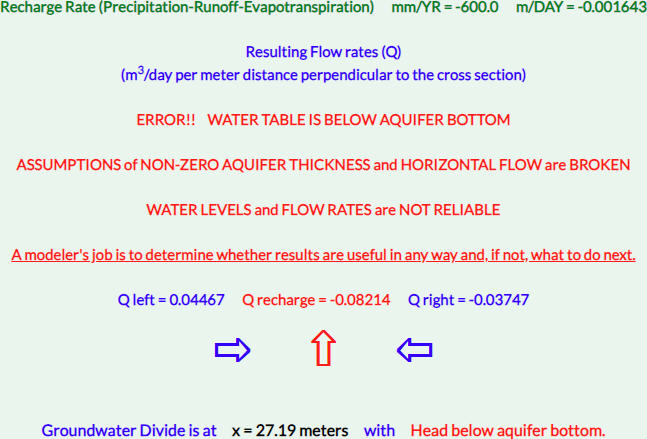
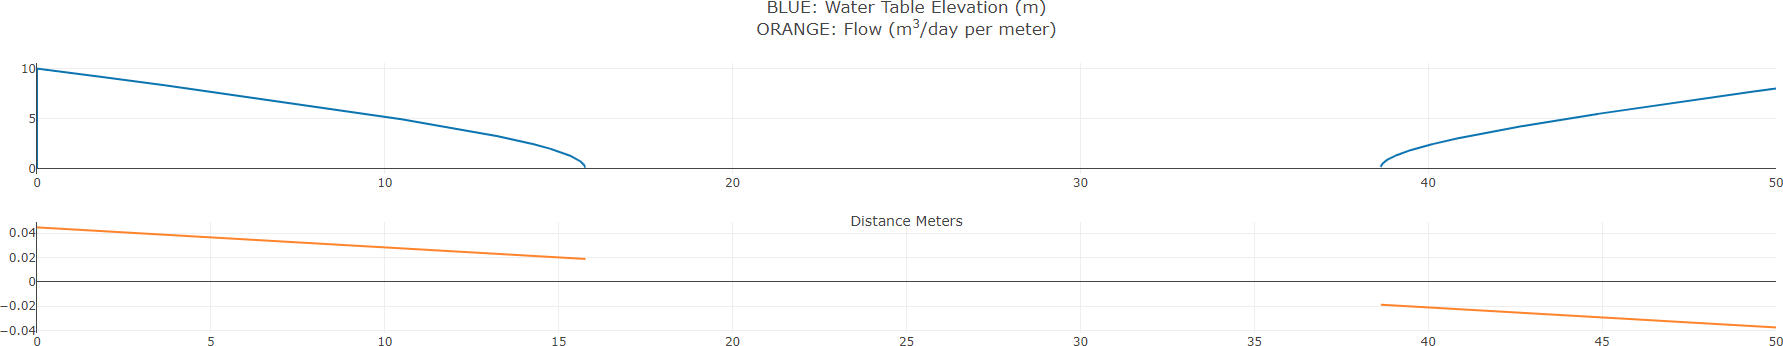
If a combination of values results in the water table being below the aquifer bottom, error messages are printed. In this case net recharge is entered as -600, so groundwater is discharging up through the surface at a rate so high that it cannot be supported given the properties that were input for the aquifer. Although the mathematics show balanced flow, the situation is not physically possible. The results are not valid because the assumptions made to develop the equations are broken. That is, uniform flow cannot occur at the surface given that nearly half the aquifer is dry at the values required to support the flow and the flow cannot be viewed as approximately horizontal.
Negative recharge is always shown in red to draw attention to it in case it is an input error.
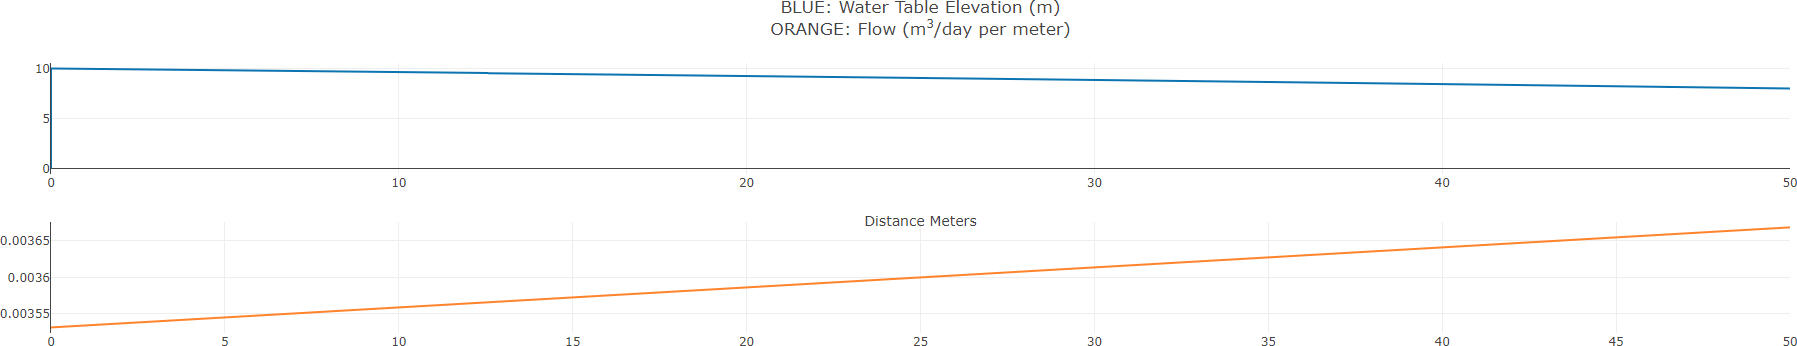
If a net negative recharge can be supported by the system, no error messages are printed and the water table has a concave form. In this case, -200, groundwater discharges up through the surface and is balanced by inflow from the water bodies.