
5.2. Periodic changes in surface water level#
Periodic head variations in an aquifer may be caused by, e.g., tides, seasonal fluctuations, or the periodic operation of dams. The surface water level variation is approximated here as a sinusoidal fluctuation with one specific amplitude and one specific period. Surface water level variations can commonly be expressed as a combination of several sinusoidal fluctuations with their own amplitude and period; the response to such a combined variation may be computed through superposition.
Consider one-dimensional flow in a semi-infinite aquifer (see Figure 5.6). There is no areal recharge and no flow at infinity
The transmissivity \(T\) of the aquifer is approximated as constant. The aquifer is bounded by open water at \(x=0\), which fluctuates as
where \(A\) is the amplitude of the fluctuation, \(t_p\) is the time of the peak, and \(\tau\) is the period of the fluctuation. There is no initial condition; that is, the head at \(x=0\) has fluctuated as ((5.33)) forever (in practice, for a long time).
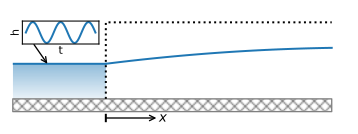
Figure 5.6 Groundwater response to periodic changes in surface water level.#
The solution to the stated problem may be obtained with separation of variables and was first published by Forchheimer (1919, p. 1229). It turns out that the head response in the aquifer may be written in the same form as the head variation in the surface water, but the amplitude \(B\) of the variation is smaller than \(A\) and the peak arrives \(t_s\) later (Jacob, 1950, p. 365)
The amplitude \(B\) of the head variation dampens with distance as
and the time shift \(t_s\) of the peak is
Note that both the amplitude \(B\) and the phase shift \(t_s\) are a function of the diffusivity \(T/S\). This means that when the amplitude and peak time of a tidal response are measured to estimate aquifer parameters, only the aquifer diffusivity can be estimated, not the individual values of \(S\) or \(T\). Estimation of (combinations of) aquifer parameters from the tidal response is also referred to as the tidal method (e.g., Ferris, 1952; Carr and Van Der Kamp, 1969).
Equation ((5.35)) shows that the amplitude \(B\) dampens out more quickly for shorter tidal periods than for longer tidal periods. The characteristic length \(\mu\) is introduced as
so that the amplitude may be written as
At a distance of \(x=3\mu\), the amplitude has dampened to 5% of the amplitude at \(x=0\). This result may be used as a rule of thumb to assess whether periodic fluctuations in surface water levels need to be taken into account when considering the head and flow in an aquifer. If the area of interest is farther away from a surface water body than \(3\mu\), periodic fluctuations of the surface water level with a period of \(\tau\) may be neglected.
As an example, consider an aquifer bounded by a tidal river. The head in the aquifer is plotted at four different times during one tidal period (Figure 5.7). The amplitude in the river is set to 1 m. The head variation is bounded by the amplitude \(B\), which is shown with the dashed line in the code below. The solution is shown with an animation.
# parameters
T = 1000 # transmissivity, m^2/d
S = 0.1 # storate coefficient, -
tau = 0.5 # tidal period, d
tp = 0 # time of peak at canal, d
mu = np.sqrt(T * tau / (S * np.pi)) # characteristic length, m
print(f'characteristic length: {mu:.2f} m')
characteristic length: 39.89 m
# solution for unit amplitude
def head(x, t, tau, S, T, tp=0, t0=0):
B = np.exp(-x * np.sqrt(S * np.pi / (T * tau)))
ts = x * np.sqrt(S * tau / (4 * np.pi * T))
return B * np.cos(2 * np.pi * (t - tp - ts) / tau)
# basic plot
x = np.linspace(0, 200, 100)
for t in np.arange(0, tau, tau / 4):
h = head(x, t, tau, S, T, tp)
plt.plot(x, h)
plt.plot(x, np.exp(-x / mu), 'k--')
plt.plot(x, -np.exp(-x / mu), 'k--');