
5.3. Areal recharge between two rivers#
The solution for steady recharge between two parallel rivers in an aquifer with constant transmissivity \(T\) that was presented in Section 1.2 is extended to include transient recharge. The rivers are a distance \(L\) apart; the origin of the coordinate system is chosen halfway between the two rivers (Figure 5.9). Initially, the head in the aquifer is at steady state, so the initial transient head equals zero. The rivers are in direct contact with the aquifer and the river stages are fixed so that the boundary conditions and initial condition of the transient head are
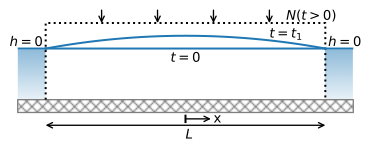
Figure 5.9 Transient recharge between two rivers (\(t_1>0\)).#
At time \(t=0\), areal recharge starts at a constant and uniform rate \(N\). The solution for the head in the aquifer as a function of time can be obtained with separation of variables and results in the following infinite series (Bruggeman, 1999, solution 133.16)
Note that for large times, the exponential term in the solution goes to zero and the head approaches the steady state solution \(\tfrac{-N}{2T}\left(x^2 - \tfrac{1}{4}L^2\right)\), which is Eq. ((1.24)) for the case that the
heads in the river are set to zero and the origin of the coordinate system is halfway between
the two rivers.
In the following example, the head is plotted vs. \(x\) at three early times and at three late times and for a different number of terms in the series solution (Figure 5.10). For the early times, the solution is plotted using three terms in the series (dashed lines), which is not sufficient as a distinct wiggle is visible, especially for \(t=1\) d. For later times, the dashed solution represents only one term in the series solution, which is indistinguishable from the solution with ten or more terms.
# parameters
L = 1000 # aquifer length, m
S = 0.1 # storage coefficient, -
T = 200 # transmissivity, m^2/d
N = 0.001 # recharge rate, m/d
# solution
def head(x, t, T=T, S=S, L=L, N=N, nterms=10):
h = 0
for n in range(nterms):
h += (-1)**n / (2 * n + 1)**3 * \
np.cos(((2 * n + 1) * np.pi * x) / L) * \
np.exp(-((2 * n + 1)**2 * np.pi**2 * T * t) / (S * L**2))
h = -N / (2 * T) * (x**2 - L**2/4) - 4 * N * L**2 / (np.pi**3 * T) * h
return h
# basic head plot
plt.subplot(121) # early time
x = np.linspace(-L / 2, L / 2, 100)
for t in [1, 2, 3]:
plt.plot(x, head(x, t, nterms=3), '--')
plt.plot(x, head(x, t, nterms=10))
plt.subplot(122) # late time
for t in [40, 80, 160]:
plt.plot(x, head(x, t, nterms=1) , '--') # just 1 term is enough
plt.plot(x, head(x, t, nterms=10))
plt.plot(x, head(x, 0, nterms=0), 'k'); # 0 terms gives steady solution
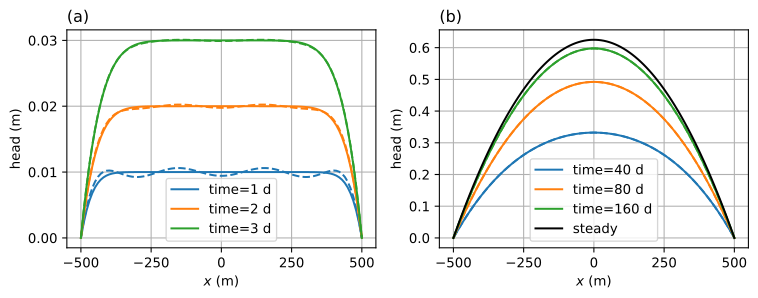
Figure 5.10 Transient infiltration between two rivers; early response with three terms (dashed) and ten terms (solid) (left) and late response with one term (dashed) and ten terms (solid) (right).#
At early times, the graph on the left shows that the head in the middle part of the aquifer rises at a rate \(N/S=0.01\) m/d, as discharge to the rivers does not have any draining effect on the middle part yet. When time progresses from 1 to 2 to 3 days, a larger and larger section of the aquifer drains toward the rivers. The head at \(t=160\) d approaches the steady state solution, as shown in the right graph.
The characteristic time \(t_{95}\) of the system is defined here as the time it takes for the head to reach 95% of the steady state level. An approximate equation for \(t_{95}\) is obtained by first approximating the solution ((5.40)) with the first term in the series solution
where
The cosine term may be further simplified with the first two terms of its Taylor series (\(\cos(x)\approx 1 - x^2/2\))
where it is used that \(\tfrac{4}{2\pi}\approx \tfrac{1}{2}\) and \(\tfrac{8}{\pi^3}\approx \tfrac{1}{8}\). The head may now be approximated as
It follows that at time \(t=\tau\), the head has reached \(1-\text{e}^{-1}=63\%\) of its final value, and at time \(t=3\tau\), the head has reached 95% of its final value. Hence, the characteristic time \(t_{95}\) may be approximated as
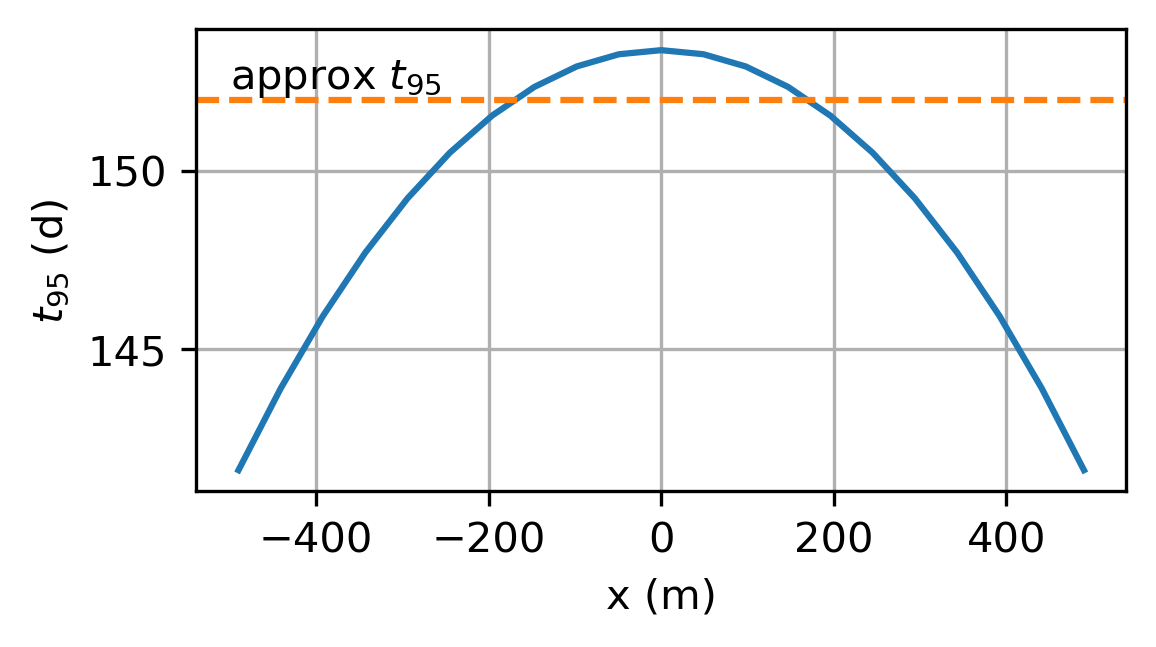
Equation ((5.45)) is a reasonable approximation of \(t_{95}\) for the entire aquifer, as is explored in the exercise below. The characteristic time \(t_{95}\) is also referred to as the memory of the system, as the head is back to its original value \(t_{95}\) after a recharge event ends. For the parameters used here, the value of \(t_{95}\) may be computed as
t95 = 3 * S * L**2 / (np.pi**2 * T)
print(f'The memory of the system is: {t95:0.0f} d')
The memory of the system is: 152 d
Exercise 5.6
Compute the memory of the system \(t_{95}\) using 10 terms in the solution for 20
equally spaced points between the two rivers, and plot the memory of the system vs. \(x\); use the fsolve method from scipy.optimize to find \(t_{95}\), similar to the use of fsolve in Section 3.2. In the same graph, plot \(t_{95}\) according to Eq. ((5.45)).
Solution
Solution ((5.40)) is known as a step response: It is the response to a step in the recharge from zero to \(N\). The unit step response is the response to a unit step in the recharge from zero to one. In addition to the unit step response, there is the unit block response, which is the response to a unit of recharge per day for a period \(\Delta t\) and zero after that; \(\Delta t\) is referred to as the length of the block. The block response \(b\) is obtained through superposition of two step responses
where \(s(x,t)\)is the unit step response starting at \(t=0\), and \(s(x,t−\Delta t)\) is the unit step response starting at \(t=\Delta t\). The unit step response \(s(x,t)\) is computed with Eq. ((5.40)) by setting the recharge \(N\) to 1.
The step response and block response are plotted at two locations in Figure 5.11. This represents the head response in an observation well at the specified value of \(x\). The block response is the same as the step response during the length of the block \(t\). The dotted lines in the corresponding colors represent the final steady levels of the step responses. The black dashed line indicates the head rise in the absence of the rivers (i.e., the head rise is \(N/S=0.01\) m/d). The head in the observation well farthest away from the rivers (in this case, at \(x=0\)) follows the dashed line for the longest period, up to ~20 days.
The memory of the system is indicated with the vertical lines representing the \(t_{95}\) times for the step response and the block response; the latter is obtained as \(t_{95}\) after the block recharge has ended. Note that for this case, the memory of the system is 152 days, and the head in the aquifer is approximately back to its original value 152 days after the end of the recharge event.
# plot step recharge and response and block recharge and response at x=0
x = 0
delt = 365 / 12
t = np.linspace(0, 210, 211)
plt.subplot(221)
plt.plot([0, 210], [1, 1])
plt.subplot(222)
plt.plot([0, 30, 30, 210], [1, 1, 0, 0])
plt.subplot(223)
h = N * head(x, t, N=1)
plt.plot(t, h)
plt.subplot(224)
h[t > delt] -= N * head(x, t[t > delt] - delt, N=1)
plt.plot(t, h);
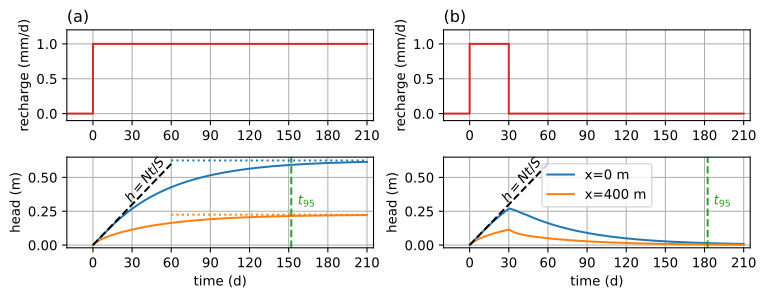
Figure 5.11 Step recharge (upper left) and the resulting step response with \(t_{95}\) after the start of step (lower left); block recharge for 30 days (upper right) and the resulting step response with \(t_{95}\) after the end of block (lower right); black dashed line is \(h=Nt/S\).#
The response to a series of recharge events of equal length \(\Delta t\) is computed using superposition. For example, if the recharge in the first three periods is \(N_0\), \(N_1\), and \(N_2\), then the head at \(t=0, \Delta t, 2\Delta t,\) and \(3\Delta t\) can be computed as
A Python implementation for three time steps is
N = np.array([1, 2, 3])
b = np.array([40, 20, 10])
h = np.zeros(4)
h[1] = np.sum(N[0] * b[0])
h[2] = np.sum(N[0] * b[1] + N[1] * b[0])
h[3] = np.sum(N[0] * b[2] + N[1] * b[1] + N[2] * b[0])
print(h)
[ 0. 40. 100. 170.]
This can be generalized with a for loop, where it is used that b[n - 1::-1] stands for array b, starting at index n - 1 going to 0 with steps of -1 (i.e., backwards).
h = np.zeros(4)
for n in range(1, 4):
h[n] = np.sum(N[:n] * b[n - 1::-1])
print(h)
[ 0. 40. 100. 170.]
As an example, consider the following four years of recharge values (in mm/d) for monthly periods (the recharge is constant during each month). These recharge values are from an area with a temperate climate with a shallow water table and computed as the precipitation excess. The recharge is highest in the fall and winter, and can become negative in the spring and summer months when vegetation draws water from the water table.
# four years of monthly recharge data
delt = 365 / 12
recharge = 0.001 * np.array( # convert recharge from mm/d to m/d
[ 1.2, 1.5, 0.8, -1.2, 0.2, -2.9, -0.6, 2.8, 1.2, 0.9, 3.8,
1.8, 1.9, 1.8, -0.6, -1.3, -2.5, 0.6, 0.9, 1.8, -0.3, 0.8,
-0.2, 3.8, 2.8, 0.3, -0.5, 0.3, -1.1, 1.5, 1. , -1.5, 0.1,
1.5, 1. , 4. , 1.3, 1.3, 0.3, -1.1, 0.6, -0.8, -1.2, -1.6,
1.3, 1.4, 2.4, 2.6])
ntime = len(recharge) # number of month
A function is written for the discrete block response \(b(x,n,\Delta t)\), which is the head response for a unit of recharge during a block of length \(\Delta t\). The discrete block response returns the head at ntime equal intervals \(\Delta t\).
# discrete block response
def bresponse(x, ntime, delt, T=T, S=S, L=L, nterms=10):
t = np.linspace(delt, ntime * delt, ntime)
return head(x, t, T, S, L, 1, nterms) - \
head(x, t - delt, T, S, L, 1, nterms)
The head is computed and plotted at two points in the aquifer through the outlined approach (Figure 5.12). Note that the unit block response is computed only once at each location. The yearly head variation halfway between the two rivers (\(x=0\)) is almost 2 m, while the head variation closer to the river is much smaller. The highest heads occur around January, and the lowest heads around July. The computed head in the first months (shown by a dashed line) is not very realistic as it is based on recharge since the beginning of the first year only, while the head also depends on the recharge in the previous year. After \(t_{95}=152\) days (the memory of this system), the effect of the previous year is negligible.
# solution
hl = np.zeros(ntime + 1) # head at x=0
h400 = np.zeros(ntime + 1) # head at x=400
b0 = bresponse(0, ntime, delt, T, S, L)
b400 = bresponse(400, ntime, delt, T, S, L)
for n in range(1, len(recharge) + 1):
hl[n] = np.sum(recharge[0:n] * b0[n - 1::-1])
h400[n] = np.sum(recharge[0:n] * b400[n - 1::-1])
# basic plot recharge data and head response
plt.subplot(211)
time = np.linspace(0, ntime * delt, ntime + 1)
plt.step(time[:-1], 1000 * recharge, where='post'); # plt.stairs in mpl>=3.4
plt.grid()
plt.subplot(212)
plt.plot(time, hl, label='$x=0$ m')
plt.plot(time, h400, label='$x=400$ m')
plt.legend();